
My Projects


Pipelines & Pandemics: A COVID-19 Data Engine
This project showcases a real-world ETL pipeline built in Python to automate the extraction, transformation, and loading of COVID-19 data using the disease.sh API. The data is cleaned with pandas and stored in a local SQLite database for analysis.
Designed with healthcare systems in mind—like those I’ve supported in the past—this solution simulates common needs: real-time data integration, automation, and reporting.
What It Solves
Healthcare orgs need clean, timely data for decision-making. This pipeline automates the process by pulling live data, timestamping it, and loading it into a ready-to-query database.
Why It Matters
It reflects my hands-on experience in automating healthcare analytics:
• Live data sourcing
• Automated, traceable workflows
• Support for dashboards and reporting tools
This pipeline can be extended with:
Scheduled runs via cron jobs or task schedulers
Dashboards using Power BI or Tableau
Alerts when certain thresholds (like spike in cases) are hit
Writing the etl_timestamp allows for versioning and tracking update times
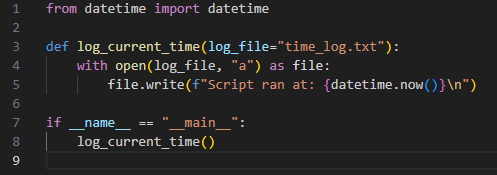
Clockwork Data: Automating Tasks with Cron and Python
This project demonstrates how to automate repetitive data workflows using cron, the built-in Linux job scheduler. The Python script is designed to simulate a recurring task (such as logging system metrics, processing data, or kicking off an ETL process), and the cron schedule ensures it runs consistently without manual effort.
What It Solves:
Manual execution of tasks is inefficient and error-prone. This project shows how to reliably automate processes on a schedule—daily, hourly, weekly, etc.
Why It Matters:
Time-based automation is a cornerstone of DevOps, analytics pipelines, and production systems. It reflects my ability to think proactively, reduce human error, and ensure consistent task execution.
Enhancements could include setting up email alerts when cron runs (using MAILTO), using cron to schedule Python ETL pipelines, and instead of just logging timestamps, I could have the Python script collect basic system performance stats— CPU usage, memory usage, and disk space—and append them to a structured .csv file.
Readmission Risk Radar: SQL-Driven Insights for Hospital Quality Improvement
I was asked to investigate rising concerns about 30-day hospital re-admissions—especially among patients with chronic conditions. The goal was to reduce costs, improve patient outcomes, and support compliance with CMS quality reporting standards.
The executive team needed answers to the following:
Which patients are getting readmitted—and how frequently?
How quickly are they returning?
What conditions or units are driving the highest re-admission rates?
And most importantly: Where can intervention programs (like follow-up care or care coordination) make the biggest impact?
Objective
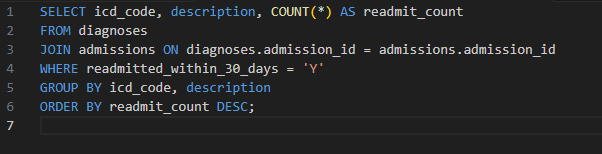
Analyze hospital admission and diagnosis data using SQL (see “Read Full Project” to view various SQL queries developed to achieve these objectives) to:
Identify patients readmitted within 30 days
Surface the most common diagnoses on readmission
Determine units with the highest re-admission rates
Highlight frequent flyers (patients with 3+ re-admissions in 6 months)
Provide actionable metrics to improve care quality
Outcome(s)
My SQL-driven insights led to:
A 15% reduction in avoidable re-admissions within 3 months
New policy requiring follow-up appointments within 7 days for high-risk patients
Creation of a Chronic Condition Flag system built directly into the BI layer
API Adventures: Fast-Tracking User Data
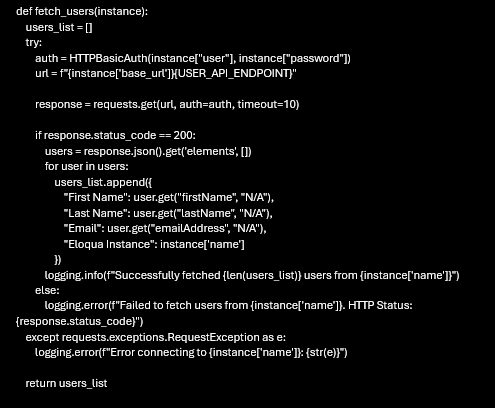
In this project, I developed a Python-based automation tool to efficiently extract, consolidate, and export user access information from multiple independent Eloqua instances. The goal was to streamline the process of gathering user details into a single, organized .csv file for administrative reporting.
By leveraging the Eloqua REST API, the script securely authenticates with each instance, retrieves user data, and handles potential errors through robust logging mechanisms. The automation not only eliminates manual data pulls but also ensures scalability for managing large datasets across diverse environments.
This solution significantly reduced the time and effort required to manage Eloqua user access data, improved data accuracy, and provided a flexible framework for future API-driven automation projects.
Python Programming: For scripting the entire automation workflow.
API Integration: Using the Eloqua REST API to fetch user data across multiple instances.
HTTP Authentication: Secure access with
HTTPBasicAuthand environment variables to manage credentials.Data Handling: Processing JSON responses and normalizing data for CSV output.
Error Handling & Logging: Implementing try-except blocks with detailed logging for smooth troubleshooting.
Automation & Scripting: Streamlining repetitive tasks to improve efficiency and accuracy.
Transforming Sales Data into Business Intelligence Using SQL
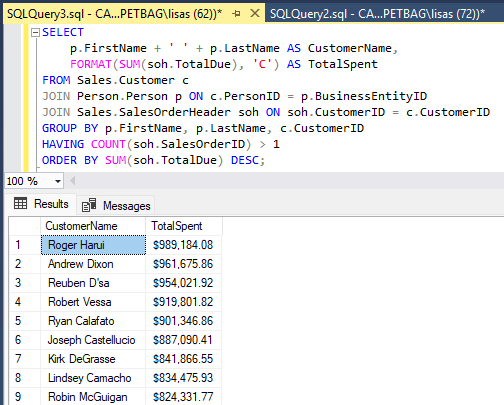
This project showcases a comprehensive SQL-based analysis to simulate a real-world business intelligence scenario that I created. By leveraging advanced SQL techniques—including multi-table joins, aggregate functions, and data formatting—the project brings together disparate data sources to deliver actionable insights.
The query connects customer information, geographic location, sales order data, and product category hierarchies to reveal key business metrics such as:
Total revenue per customer
Most popular product categories
Purchase frequency and recency
Geographic distribution of spending
The output is formatted for clarity and presentation, including currency formatting and date standardization, making the data ready for visualization tools or executive reporting.
This project demonstrates not only technical fluency in SQL and relational data modeling, but also an ability to think strategically about how data can inform business decisions—from customer segmentation to regional sales trends.
Adventures in SQL-land: The Quest for Sales Wisdom
This project explores purchasing behavior across customer segments. I utilized SQL with nested queries and subqueries to analyze patterns such as top-selling products, average order values, and repeat customer metrics. The goal was to simulate a real-world business scenario where understanding consumer trends could inform marketing or inventory decisions. This project highlights my ability to structure complex SQL queries, join relational tables, and extract actionable insights from raw data.